GeoJSON: Hover Events in VTS-Browser-JS
This tutorial will show you how to handle geodata hover events with Melown VTS-Browser-JS.
As a prerequisite you should be able to display GeoJSON with VTS Browser. If you don’t know how to do that or you need a reminder check our previous tutorials (part1, part2) on this topic.
You can check live demo and source code of this tutorial here.
Preparing base data
First, we need some geodata on which we shall listen for hover events. We’ll start by displaying red a and blue line on our map.
var browser = null;
var renderer = null;
var map = null;
var geodata = null;
var statusDiv = null;

function startDemo() {
    browser = vts.browser('map-div', {
        map: 'https://cdn.melown.com/mario/store/melown2015/map-config/melown/VTS-Tutorial-map/mapConfig.json',
        position : [ 'obj', 15.096869, 49.3843590, 'float', 0.00, 2.70, -77.86, 0.00, 692772.54, 55.00 ]
    });
    renderer = browser.renderer;
    browser.on('map-loaded', onMapLoaded);
};

function onMapLoaded() {
    map = browser.map;
    geodata = map.createGeodata();

    //add line to geodata with id = 'blue-line'
    geodata.addLineString([
        [13.4836691, 49.6285568, 0],
        [13.8559398, 49.2926023, 0],
        [14.3590684, 49.1136598, 0],
        [15.2561336, 49.0637509, 0],
        [15.8564221, 49.2444548, 0],
        [16.2429312, 49.5161402, 0]
    ], 'float', { a : 1, b : 2 }, 'blue-line');

    //add line to geodata with id = 'red-line'
    geodata.addLineString([
        [13.4836691, 50.6285568, 0],
        [13.8559398, 50.2926023, 0],
        [14.3590684, 50.1136598, 0],
        [15.2561336, 50.0637509, 0],
        [15.8564221, 50.2444548, 0],
        [16.2429312, 50.5161402, 0]
    ], 'float', { a : 4, b : 5 }, 'red-line');

    geodata.processHeights('heightmap-by-precision', 62, onHeightProcessed);
}


function onHeightProcessed() {

    var style = {
        'constants': {
            '@icon-marker': ['icons', 6, 8, 18, 18]
        },

        'bitmaps': {
            'icons': 'http://maps.google.com/mapfiles/kml/shapes/placemark_circle.png'
        },

        "layers" : {
            "some-red-line" : {
                "filter" : ["==", "#id", "red-line"],
                "line": true,
                "line-width" : 4,
                "line-color": [255,0,0,255],
                "zbuffer-offset" : [-5,0,0],
                "z-index" : -1
            },

            "some-blue-line" : {
                "filter" : ["==", "#id", "blue-line"],
                "line": true,
                "line-width" : 4,
                "line-color": [0,0,255,255],
                "zbuffer-offset" : [-5,0,0],
            },

            "line-shadow" : {
                "line": true,
                "line-width" : 40,
                "line-color": [0,0,0,100],
                "zbuffer-offset" : [-5,0,0]
            }
        }
    };

    //make free layer
    var freeLayer = geodata.makeFreeLayer(style);

    //add free layer to the map
    map.addFreeLayer('geodatatest', freeLayer);
    var view = map.getView();
    view.freeLayers.geodatatest = {};
    map.setView(view);
}

startDemo();
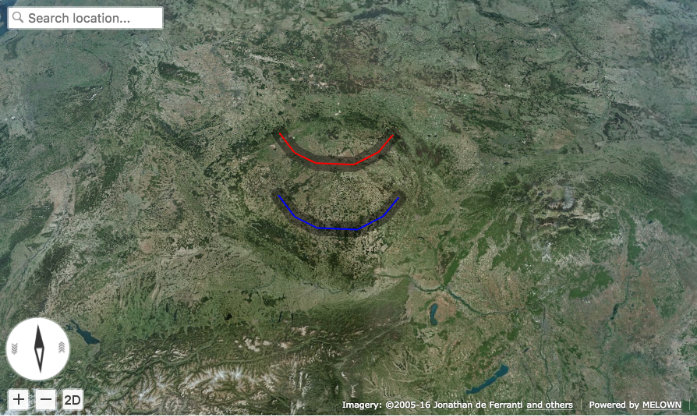
Red and blue lines.
Adding UI to display hover state
Now we’ll add a ui element that will
display information about hovered state. Expand startDemo function in
the following way:
function startDemo(){
    browser = vts.browser(...) // omitted for simplicity

    var panel = browser.ui.addControl('status-panel',
        '<div id="status-div">' +
            'Hovering over: nothing' +
        '</div>');


    statusDiv = panel.getElement('status-div');
    browser.on('map-loaded', onMapLoaded);
}
We added new div with id status-div and assigned it to variable
statusDiv. We are using our``getElement()`` to make sure we get the
right element in case more applications are embedded in the same page.
Next, add some styling to new component:
 #status-div {
      font-family: Arial, 'Helvetica Neue', Helvetica, sans-serif;
      position: absolute;
      right: 12px;
      bottom: 30px;
      width: 288px;
      height: 150px;
      padding: 10px;
      background: #fff;
      border: 1px solid #000000;
      border-radius: 4px;
      font-size: 20px;
}
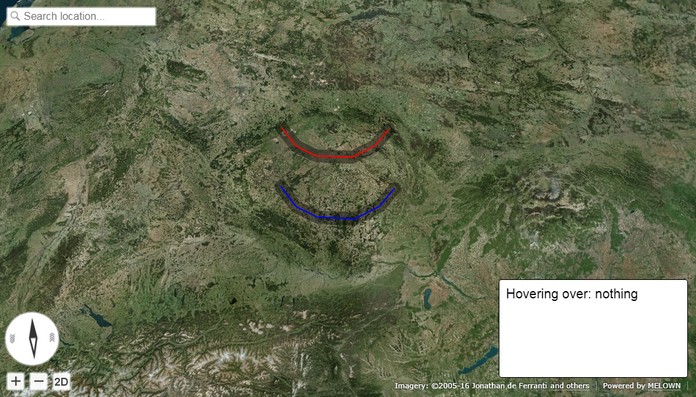
Added status-div element
Hover events
To enable hover events generation for geodata we need to add
hover-event:true property to style layer. We’ll use
line-shadow in our case.
var style = {
    ...
    "line-shadow" : {
        "line": true,
        "line-width" : 40,
        "line-color": [0,0,0,100],
        "zbuffer-offset" : [-5,0,0],
        "hover-event": true // enables generation of hover events
    }
}
To listen to hover events we need to update startDemo function again
with following:
//add mouse down callback
browser.ui.getMapElement().on('mousemove', onMouseMove);
browser.ui.getMapElement().on('mouseleave', onMouseLeave);

//geodata events listeners
browser.on('geo-feature-enter', onFeatureEnter);
browser.on('geo-feature-leave', onFeatureLeave);
We added several new callback methods. Let’s implement them now. First
we need to propagate hover to browser element in onMouseMove
function.
function onMouseMove(event) {
    if (map) {
        var coords = event.getMouseCoords();
        map.hover(coords[0], coords[1], true);
    }
}
First we obtain canvas coordinates and inform the map we are hovering above given coordinates.
We also have to cancel hovering manually when the cursor leaves the map element,
otherwise hover state will hang permanently. We do this in
onMouseLeave function.
function onMouseLeave(event) {
    if (map) {
        var coords = event.getMouseCoords();
        map.hover(coords[0], coords[1], false);
    }
};
Now we are propagating mouse movements into browser. Next we’ll implement their
handling. We only need to listen to geo-feature-enter and geo-feature-leave.
There is another hover event geo-feature-hover emitted every time mouse moves
when over a feature. This is handy if we need to do different things when hovering
over different parts of the feature but it is unnecessary to use in our case.
First let’s implement onFeatureEnter to display above which geo feature we are
hovering and list it’s properties inside statusDiv element.
function onFeatureEnter(event) {
    statusDiv.setHtml('Hovering over: ' + event.feature['#id'] + '<br/><br/>' +
                      'Feature properties are: ' + JSON.stringify(event.feature) );
}
When leaving the feature, we udpdate statusDiv to its original state.
function onFeatureLeave(event) {
    statusDiv.setHtml('Hovering over: nothing');
}
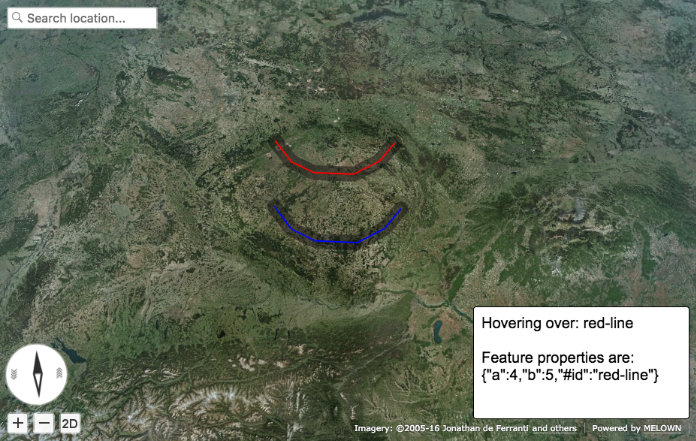
Status box with information about feature
Hover effect
Next let’s add a glowing effect to shadow when we are hovering above a line. We can
achieve this by adding a style layer line-glow` with the glow and adding hover-layer: "line-glow"
to line-shadow which generates the hover events.
var style = {
  ...
  "line-shadow" : {
      "line": true,
      "line-width" : 40,
      "line-color": [0,0,0,100],
      "zbuffer-offset" : [-5,0,0],
      "hover-event" : true,
      "hover-layer" : "line-glow"
  },
  "line-glow" : {
      "filter" : ["skip"],
      "line": true,
      "line-width" : 40,
      "line-color": [255,255,255,100],
      "zbuffer-offset" : [-5,0,0],
      "hover-event" : true
  }
}
If you did everything correctly you should see the similar outcome if you hover over the blue line.

Feature glowing effect
That’s it you’ve successfully made it to the end of the tutorial.